If you have numerous Jobs and you are drowning in detail you will find it difficult to understand your job profitability and see trends in your business.
Why not Categorise your jobs into similar groupings or into a hierarchy?
In MYOB you are able to easily setup a Job Hierarchy by creating Job Headers and then associating each detail job with a header. You can even set up multiple Job Header levels.
For example you could group your Jobs by Division (New Sales/Service/Admin) and or by State etc. Try to match the Job Headers with your your organisation is structured.
Once setup in MYOB these Job Headers will also appear in BI4Cloud where you can use them to:
- Group by
- Analyze by
- Filter
- Pivot on
- Visualize in Charts & Dashboards
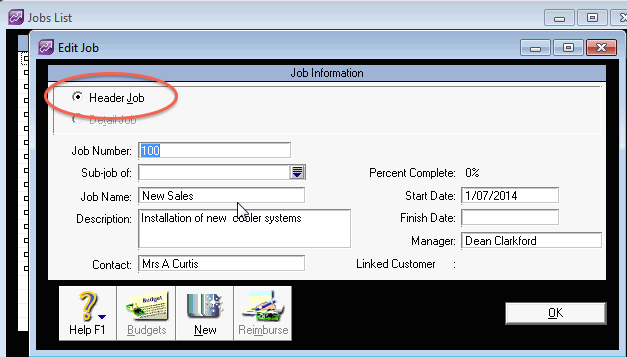
- In MYOB add new jobs that are Header Jobs.
Remember you can have more than one Level of Header Jobs. This will build up a hierarchy.
Do not set up Header Jobs for Fields in the Job Card as you will already be able to group and report based on these fields. These fields are also good to use to report "across" your jobs rather than in the Job Hierarchy:
- Manager - e.g. where each customer may have jobs across multiple divisions
- Linked Job Customer - e.g. where each customer may have jobs across multiple divisions
- Contact - This field can be used for any purpose to group and report on Jobs e.g. State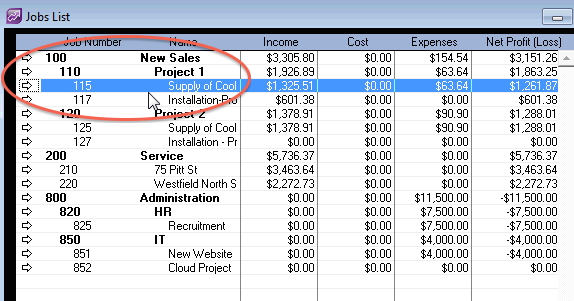
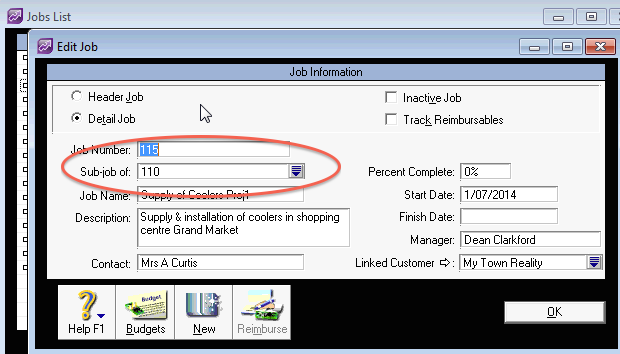
- Next assign all detail jobs to a header job. Remember that you can have multiple levels of Header Jobs.
- In BI4Cloud use Job Headers to Group by Job Header Levels to see like Jobs together.
Here all Jobs are shown as a List by placing Job Number and Job Name in the rows and Grouping these together by the Job Level 1/Job Header, in this case the Header is a Division/Department.
This is a Pivot Style report created by copying the "Simple P&L Pivot" report.- To Group by - Indent the Job number and Job name under Job Level 1 Header
-
To see activity monthly - Include Transactions by Month in the Columns
Another report that shows Jobs as a simple List grouped by the Job Header is below.Here all Jobs are shown as a List by placing Job Number and Job Name in the rows and Grouping these together by the Job Level 1/Job Header, in this case the Header is a Division/Department.
This is a Report Style created by copying the "Job List - Active" report, in the Job Analysis [Base] Workbook.- To Group by - select the Job Level 1 Header field in the Group by box
- Fields displayed are Job Number Job Name Job Customer & Job Manager
- Metrics displayed are Income / Costs / Expenses / Profit / Margin%
- Use the Transaction Date filter in the bottom/Report filters to change the date range to report
- In Bi4Cloud Use Job Header Levels to Analyze by to see your business at a higher level.
Run the Consol P&L report in the Workbook called "Divn - Divisional Analysis Template". This is a P&L showing Month to date v Year to date and Actual V Budget.
This is set up to Analyse by Job Level 1/Header, this will consolidate up all Job Numbers into the Level 1 Header, the result shows the contribution of each Division to Income, Gross Margin, Expenses etc.
As the P&L Format is set to Divisional this report even shows the Net Profit contribution from each Job Header/Division.
-
In BI4Cloud Filter on one Job Header Level to focus on just that part of your business. Then you can see a mini P&L for only Jobs under that header.
Classic Month to date v Year to date P&L
-
Pivot on a Job Header Level to compare performance across all Job Headers (Divisions).
Copy the Tab P&L by Mth, note it is set up to Pivot by Months in the Columns. If you change this to Pivot by Job Level 1, this will consolidate up all Job Numbers into the Level 1 Header, the result shows a P&L for each Divisionand chan include Actual, Budget Variance etc.
-
Chart to see the monthly Income trends by Job Headers (Divisions).
Copy the Income Bar Chart and change the Analyse by field to Job Level 1 to Analyse by Job Header, Group by Transactions by Month to get Months across the bottom and Filter for just the Job Headers you want included. This shows the contribution of each Division to total Income by month. -
Run a Dashboard then add a Filter by Job Header to create a Dashboard for each Division. Here I have filtered for Just the Pool Shop division which picks up the two Shops/Jobs under that division.
- Save - Don't forget once you have created a report tab with just the right dimensions Save the Workbook so it is there for you to use again and again.
![]()